
3. MANDELBROT SETS WITH MATLAB
Since it is always possible to represent a COMPLEX variable as a couple of real variables in Gauss' plane, MATLAB proves extremely efficient in calculating and painting the approximate domains of non convergence of the series of complex functions needed in the study of MANDELBROT sets.
A variant of the classical escape method is applied here: instead of evaluating the number of cycles required in order that the modulus of the partial sum exceeds a fixed bound, we evaluate the value of that modulus for a fixed number of cycles.
That procedure:
COLORMAPS
The use of the different system MATLAB colormaps provides different effects; in particular colormap copper produces interesting metal coloured shapes.
Here are some examples.
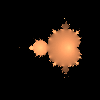 f(z)=z2+c MATLAB Script M.1
 QUESTION
What does it happen if instead of power two, different positive integer powers are introduced into the series?
 ANSWER
A Mandelbrot like set is generated with as many heads as the exponent of the power minus one.
Look at the following images!
 f(z)=z+c MATLAB Script M.2
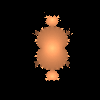 f(z)=z3+c MATLAB Script M.3
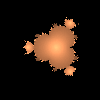 f(z)=z4+c MATLAB Script M.4
 f(z)=z5+c MATLAB Script M.5
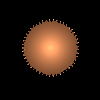 f(z)=z50+c MATLAB Script M.6

 sets with MATLAB

